Dynamics 365 Business Central New Analysis Mode
You can analyse data using your chosen fields and groups and even create pivots directly in Business Central without having to export to Excel.
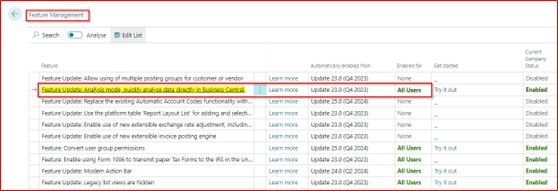
An analysis flag will be available on each list page once the feature is enabled.
You can create different analysis views of the same data. The system allows you to save multiple Analysis View tabs.
Analysis mode is a new way to interact with the data on the lists page. Rather than running through a report with different options and filtering, just keep adding tabs that represent different tasks or data views.
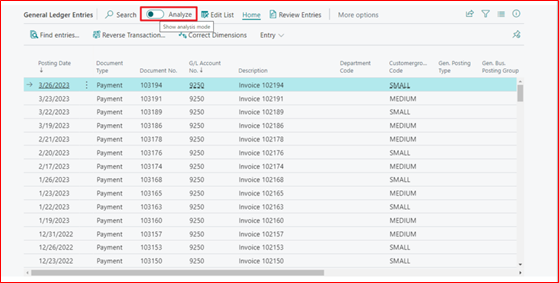
When you want to analyse data from one of the lists pages (where you may have been filtering data with one of the views or filters), just go to Analyse mode:
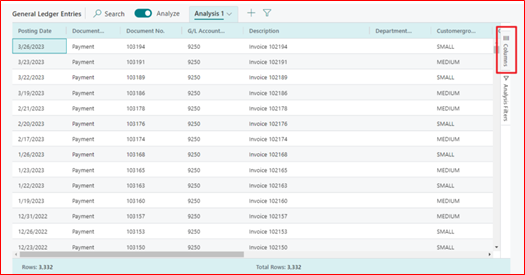
When you go into Analyse Mode, the data opens up in a new experience that's optimized for analyzing data. When a page is in Analyse mode, it's divided into two sections:
The main data area (including a tab panel).
The area for the field modifiers.
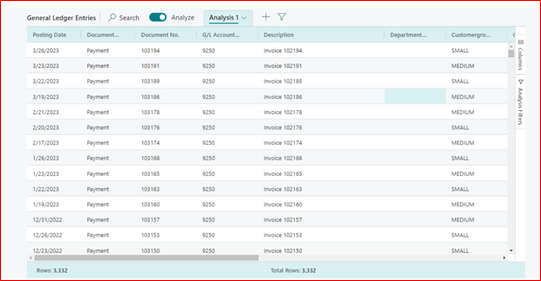
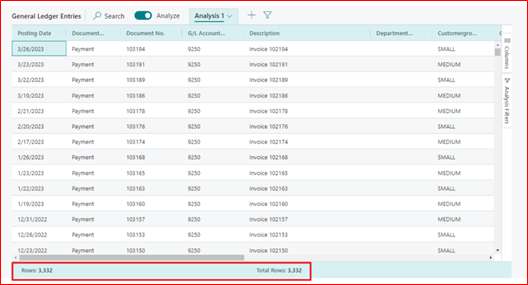
The total number of rows in the column is displayed at the bottom of the data area.
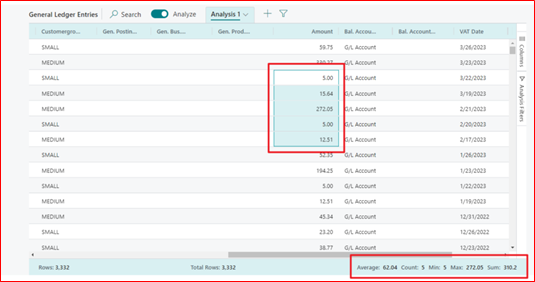
Interaction with the data is via the data area. For columns where summation is possible, simply mark the fields to obtain descriptive statistics.
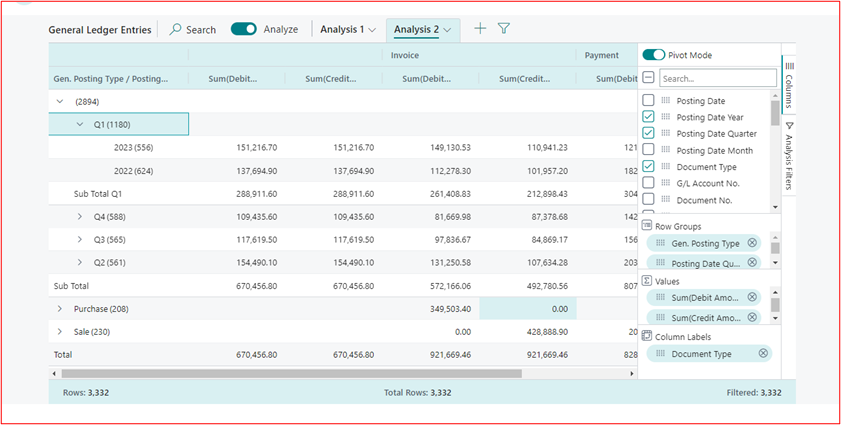
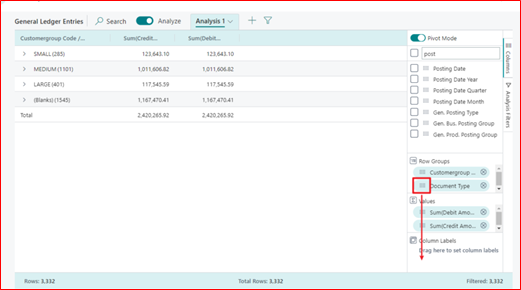
By dragging fields to the Grouping part of the Columns menu, you can group data. It allows you to explore data grouped by one or more fields to the left of the data pane. This is like Excel's Pivot-Table.
Pivot mode, which summarises the data based on the selected criteria, is another way to analyse the data.
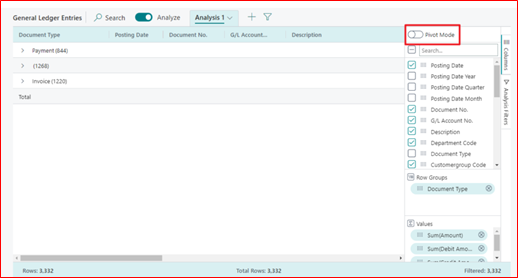
Pivot mode is very powerful, and users can create groupings on the basis of columns.
Several options are available for analyzing the values:
Average
Count
First
Last
Minimum
Max
Sum