A. Introduction
Excel Reports, a built-in feature of Business Central, allow you to create analytical reports without requiring technical support or expertise. You can use this built-in functionality to create Excel reports based on existing reports in Business Central. For example, in Business Central, there is a standard report called 'Customer - Sales List.' You can export this report, analyze the data in Excel, and once your analysis is complete, you can save it in Business Central. The next time you export this report to Excel, the system will export it with the analyzed data.
B. Prerequisite
Business Central On-Premise or Cloud.
C. Test Scenario
Let's create an export report using the 'Customer – Sales List' report. This report contains customer-wise sales amounts. We will export this report, analyze the data, create Pie charts, and add a Pivot Table.
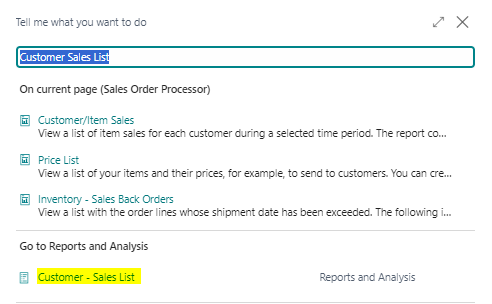
1. Click on the search icon, type 'Customer Sales List' and then select ' Customer Sales List ' from the search results.
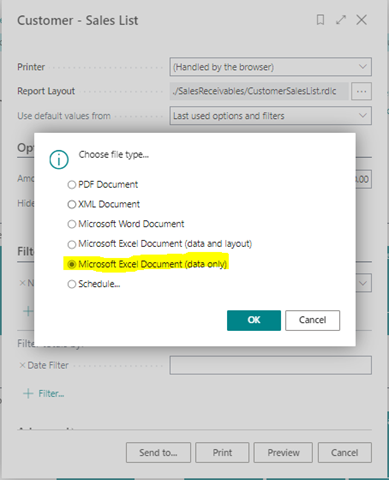
2. Run the report and export it in the “Microsoft Excel Document (data only)” format.
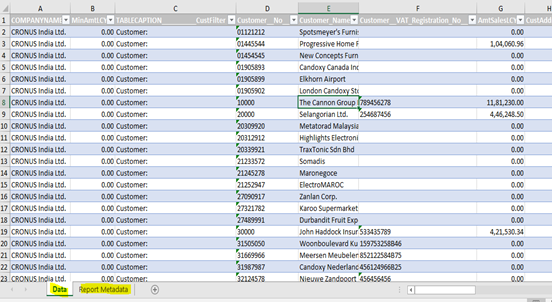
3. Open the Excel sheet and do not make any changes to the data and Report Metadata worksheet.
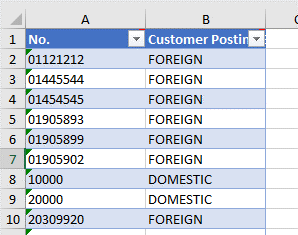
4. Create a new worksheet named “Customer Master” and add some customer details, including Customer No. and Customer Posting Group.
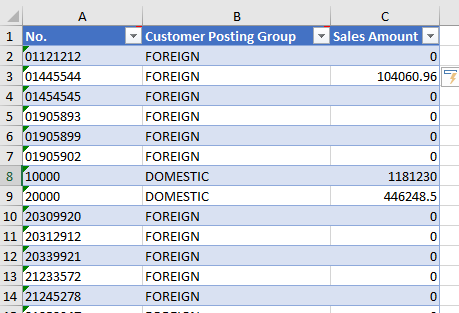
5. Now, add a new column after “Customer Posting Group” called “Sales Amount” and use “Vlookup” to retrieve the sales amount from the Data sheet.
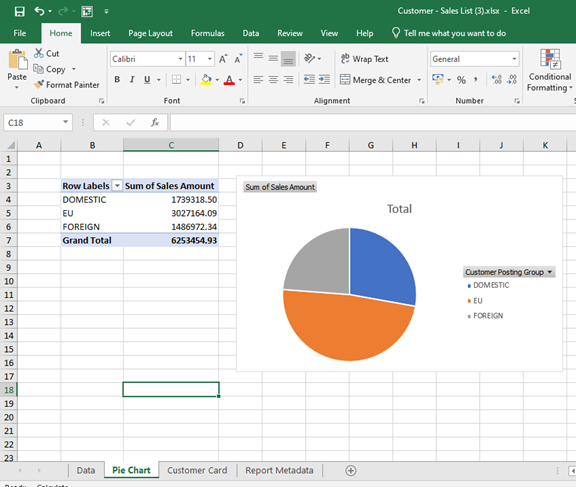
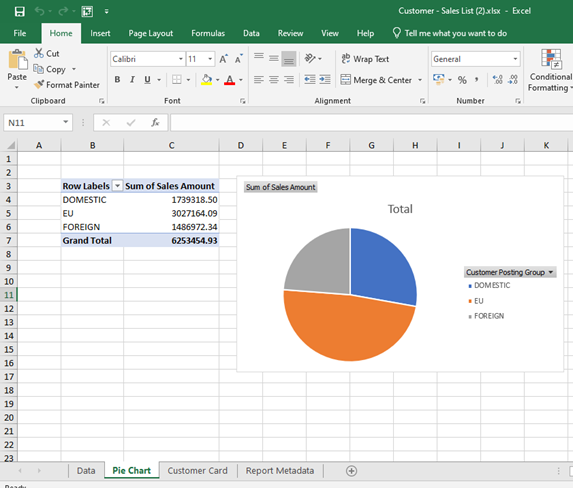
6. Create a new worksheet named 'Pie Chart,' add a Pie Chart, and insert a Pivot Table with data from the 'Customer Master' worksheet. Save the Excel file.
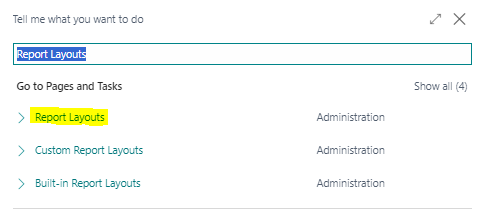
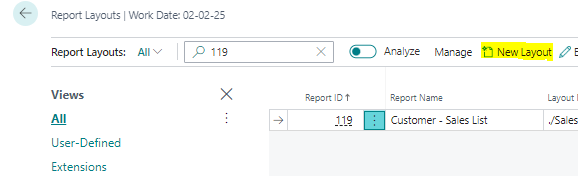
7. To upload this Excel file into Business Central, with Report Layouts, click on the search icon, type 'Report Layouts,' and then select 'Report Layouts' from the search results.
8. On the Report Layouts page, search for the 'Customer Sales List' report name or report ID “119”, and then click on 'New Layout'
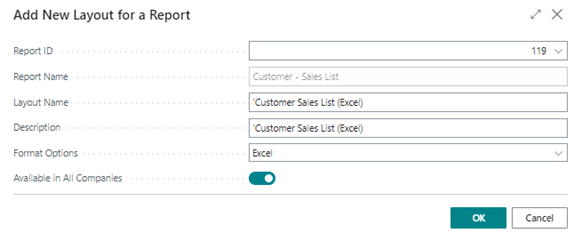
9. On the 'Add New Layout for a Report' page, the Report ID is your base report ID, which is 119. Provide the layout name and description, and select 'Excel' as the format option.
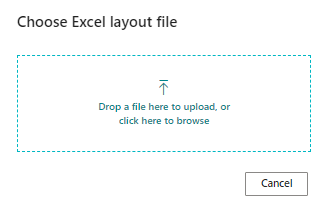
10. Click the 'OK' button and upload your Excel file.
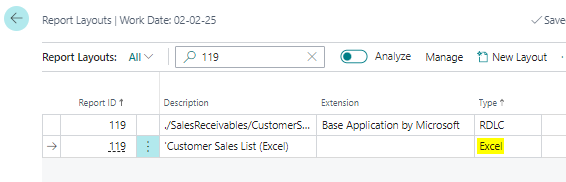
11. After the Excel file is uploaded successfully, you can see it in the report layout page.
12. Now, click on the search icon, type 'Customer Sales List,' and then select 'Customer Sales List' from the search results. On the report page, click on 'Report Layout'.
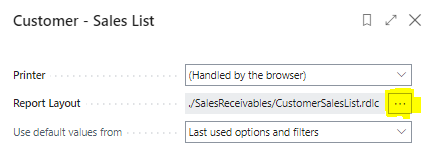
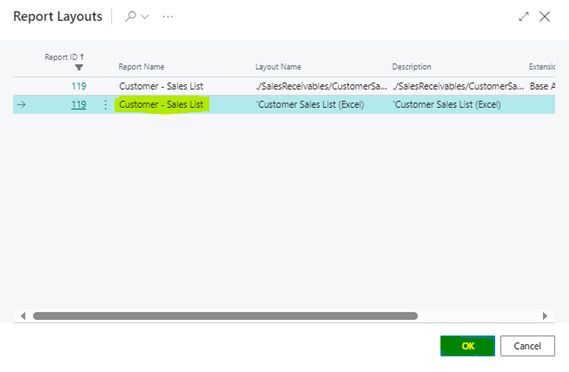
13. On the Report Layout page, select the Excel layout format, and then click the 'OK' button.
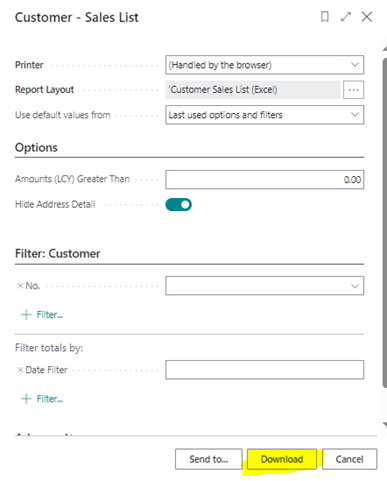
14. Click on 'Download,' and the file will be exported in Excel.
15. The final output is an Excel file in the 'Pie Chart' worksheet with your Pie Chart and Pivot Table.